


Help / How to analyze results for groups
Group reporting
FlexiQuiz provides reporting at a group level so that you can analyze and track the collective progress of Respondents within a Group.
Group reports include a summary of all activities assigned to Respondents. You can track progress, view scores and click on the quiz for more detailed results at a question level.
There are two ways to access group reports.
#1. How to access group reports from your Reports screen
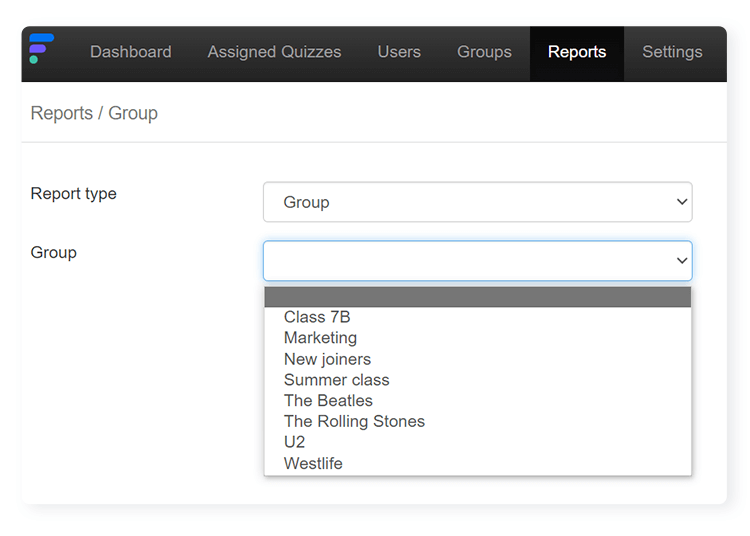
- Once you have logged into your FlexiQuiz account, select Reports from the top menu.
- Now go to the Report type and choose Group from the drop-down menu. A new drop-down menu listing all the groups linked to your FlexiQuiz account will appear.
- You can scroll down the list of groups and click on the group you want to view.
#2. How to access group reports from your Groups dashboard
-
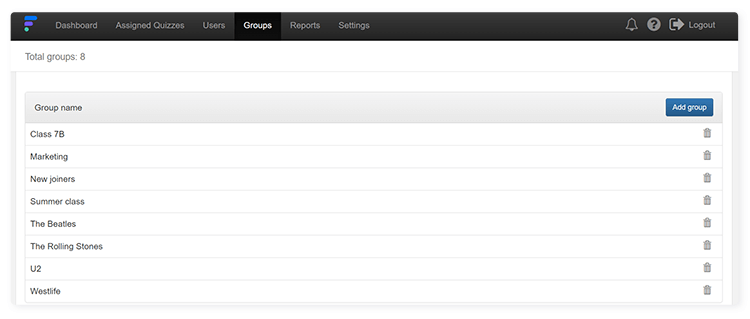
Log in to your FlexiQuiz account and select Groups from the top menu. A dashboard appears that lists all groups linked to your account.
- Next, click on the group you want to view in order to open the group profile.
- Now select the Results tab.
Information on the Group report
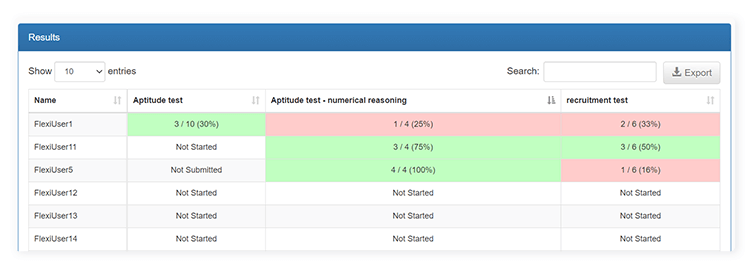
The report is in a table format and contains the following information:
- A list of all Respondents linked to the group and assigned quizzes.
- The quiz status allows you quickly to check who has started, not started or submitted the activity.
- Scores will be displayed as numbers and percentages.
- Pass or fail grades. If Respondents gain a pass grade, the box is green. If Respondents fail the test, the box is red.
You can also click on any of the results to view a detailed breakdown of the Respondent's responses, including date submitted, category scoring, time per page and answers per question.
How to work with your Group report
- Search: You can easily search the report by Respondent, quiz name or score. Just enter the information you are looking for in the search bar.
- Sort: You can sort the data by username or results by clicking the arrow next to the headings.
- Export: You can download the report in an Excel document. Click the Export button on the top right.
Relevant help guides
How to assign quizzes to a group
Back